概述
K8S 中的可观测性除了监控和日志,还有事件(Events)和审计(Audit),一般用来收集并构建事件中心、审计中心。
- K8S 事件: 如 Pod 的调度事件、Pod 的启动、拉镜像等,以 Events 形式存储,默认保留一小时,记录 K8S 中资源的状态变化。
- K8S 审计: 审计可以记录所有对 Apiserver 接口的调用,让我们能够非常清晰的知道集群到底发生了什么事情,通过记录的日志可以查到所发生的操作、用户和时间。
K8S Events 还可以做事件报警,如 Pod 创建失败,镜像拉取失败报警等,审计一般用于安全需求,尤其是多租户场景。
事件
介绍
为了让用户对 Kubernetes 的内部状态有更好的了解,Kubernetes 引入了事件(Events)系统,在 Kubernetes 的资源产生变化的时候,会以事件的形式记录在 APIServer 中,并可以通过 API或者 Kubectl 命令去查看,例如:
$ kubectl describe pod  productpage-v1-7658b8dcc6-jvswr
...........
...........
Events:
  Type    Reason     Age   From                              Message
  ----    ------     ----  ----                              -------
  Normal  Scheduled  44s   default-scheduler                 Successfully assigned default/productpage-v1-7658b8dcc6-jvswr to cn-beijing.10.1.138.111
  Normal  Pulling    42s   kubelet, cn-beijing.10.1.138.111  pulling image "docker.io/istio/examples-bookinfo-productpage-v1:1.15.0"
  Normal  Pulled     31s   kubelet, cn-beijing.10.1.138.111  Successfully pulled image "docker.io/istio/examples-bookinfo-productpage-v1:1.15.0"
  Normal  Created    31s   kubelet, cn-beijing.10.1.138.111  Created container
  Normal  Started    31s   kubelet, cn-beijing.10.1.138.111  Started container
$ kubectl get events
LAST SEEN   TYPE      REASON             KIND         MESSAGE
4m19s       Normal    Killing            Pod          Killing container with id docker://bluematador-agent:Need to kill Pod
4m19s       Normal    Killing            Pod          Killing container with id docker://bluematador-agent:Need to kill Pod
4m46s       Normal    Scheduled          Pod          Successfully assigned default/productpage-v1-7658b8dcc6-jvswr to cn-beijing.10.1.138.111
4m44s       Normal    Pulling            Pod          pulling image "docker.io/istio/examples-bookinfo-productpage-v1:1.15.0"
4m33s       Normal    Pulled             Pod          Successfully pulled image "docker.io/istio/examples-bookinfo-productpage-v1:1.15.0"
4m33s       Normal    Created            Pod          Created container
4m33s       Normal    Started            Pod          Started container
4m41s       Warning   Unhealthy          Pod          Readiness probe failed: Get http://172.25.0.24:15020/healthz/ready: dial tcp 172.25.0.24:15020: connect: connection refused
4m39s       Normal    Killing            Pod          Killing container with id docker://istio-proxy:Need to kill Pod
4m14s       Normal    Killing            Pod          Killing container with id docker://productpage:Need to kill Pod
4m46s       Normal    SuccessfulCreate   ReplicaSet   Created pod: productpage-v1-7658b8dcc6-jvswr
事件包含了发生的时间、组件、等级(Normal、Warning、Error)、类型、详细信息,通过事件我们能够知道应用的部署、调度、运行、停止等整个生命周期,也能通过事件去了解系统中正在发生的一些异常。在 Kubernetes 各个组件的源码中都会定义该组件可能会触发的事件类型,例如 kubelet的 event record源码。
Kubernetes 中的事件最终还是存储在 etcd 中,但因为量太大,默认情况下 etcd 只保存1个小时,由于 etcd 并不支持一些复杂的分析操作,默认 Kubernetes 只提供了非常简单的过滤方式,比如通过 Reason、时间、类型等。同时这些事件只是被动的存在 etcd 中,并不支持主动推送到其他系统,通常只能手动的去查看。
收集
一般 K8S Events 处理方式有两种:
- 使用 kube-eventer 之类的组件采集 Events 并推送到 ES
- 使用 event_exporter 之类的组件将Events 转化为 Prometheus Metric,同类型的还有谷歌云的 stackdriver 下的 event-exporter
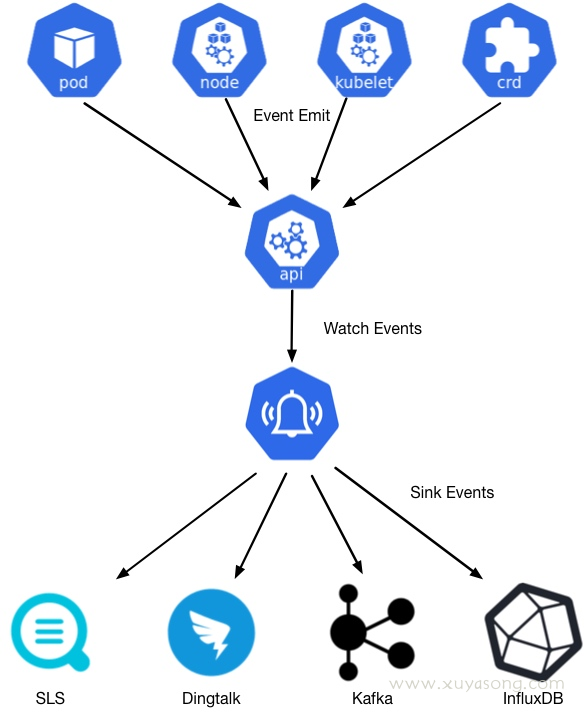
收集 events 的方法比较简单,只需要 watch v1 下的 event 资源,以kube-eventer 的逻辑为例:
// watch events
events, err := this.eventClient.List(metav1.ListOptions{
            FieldSelector: EventsFieldSelector,
        })

resourceVersion := events.ResourceVersion

watcher, err := this.eventClient.Watch(
    metav1.ListOptions{
        Watch:           true,
        FieldSelector:   EventsFieldSelector,
        ResourceVersion: resourceVersion})

// 处理 event 的 add 和 update 事件,忽略 delete
switch watchUpdate.Type {
    case kubewatch.Added, kubewatch.Modified:
        select {
        case this.localEventsBuffer <- event:
        default:
        }
    case kubewatch.Deleted:
        // Deleted events are silently ignored.
    default:
        klog.Warningf("Unknown watchUpdate.Type: %#v", watchUpdate.Type)
采集出来的 event 需要转化为 es 的格式存储,并且判断 index 和 alias,不存在则默认创建index,以日期归类,以 alias 查询。
point := esCommon.EsSinkPoint{
        FirstOccurrenceTimestamp: firstOccurrenceTimestamp,
        LastOccurrenceTimestamp:  lastOccurrenceTimestamp,
        Message:                  event.Message,
        Reason:                   event.Reason,
        Type:                     event.Type,
        Count:                    event.Count,
        Metadata:                 event.ObjectMeta,
        InvolvedObject:           event.InvolvedObject,
        Source:                   event.Source,
        EventTags: map[string]string{
            "eventID":         string(event.UID),
            "cluster_name":    clusterName,
            "source_api_type": tag,
            "region":          region,
            "serviceProvider": serviceProvider,
            "city":            city,
        },
    }
存储展示
采集出来的 events 和日志处理逻辑是一样的,可以直接推送到 es 或者 kafaka,然后调用es api 绘图展示,如 kibana 或dashboard
kibana:
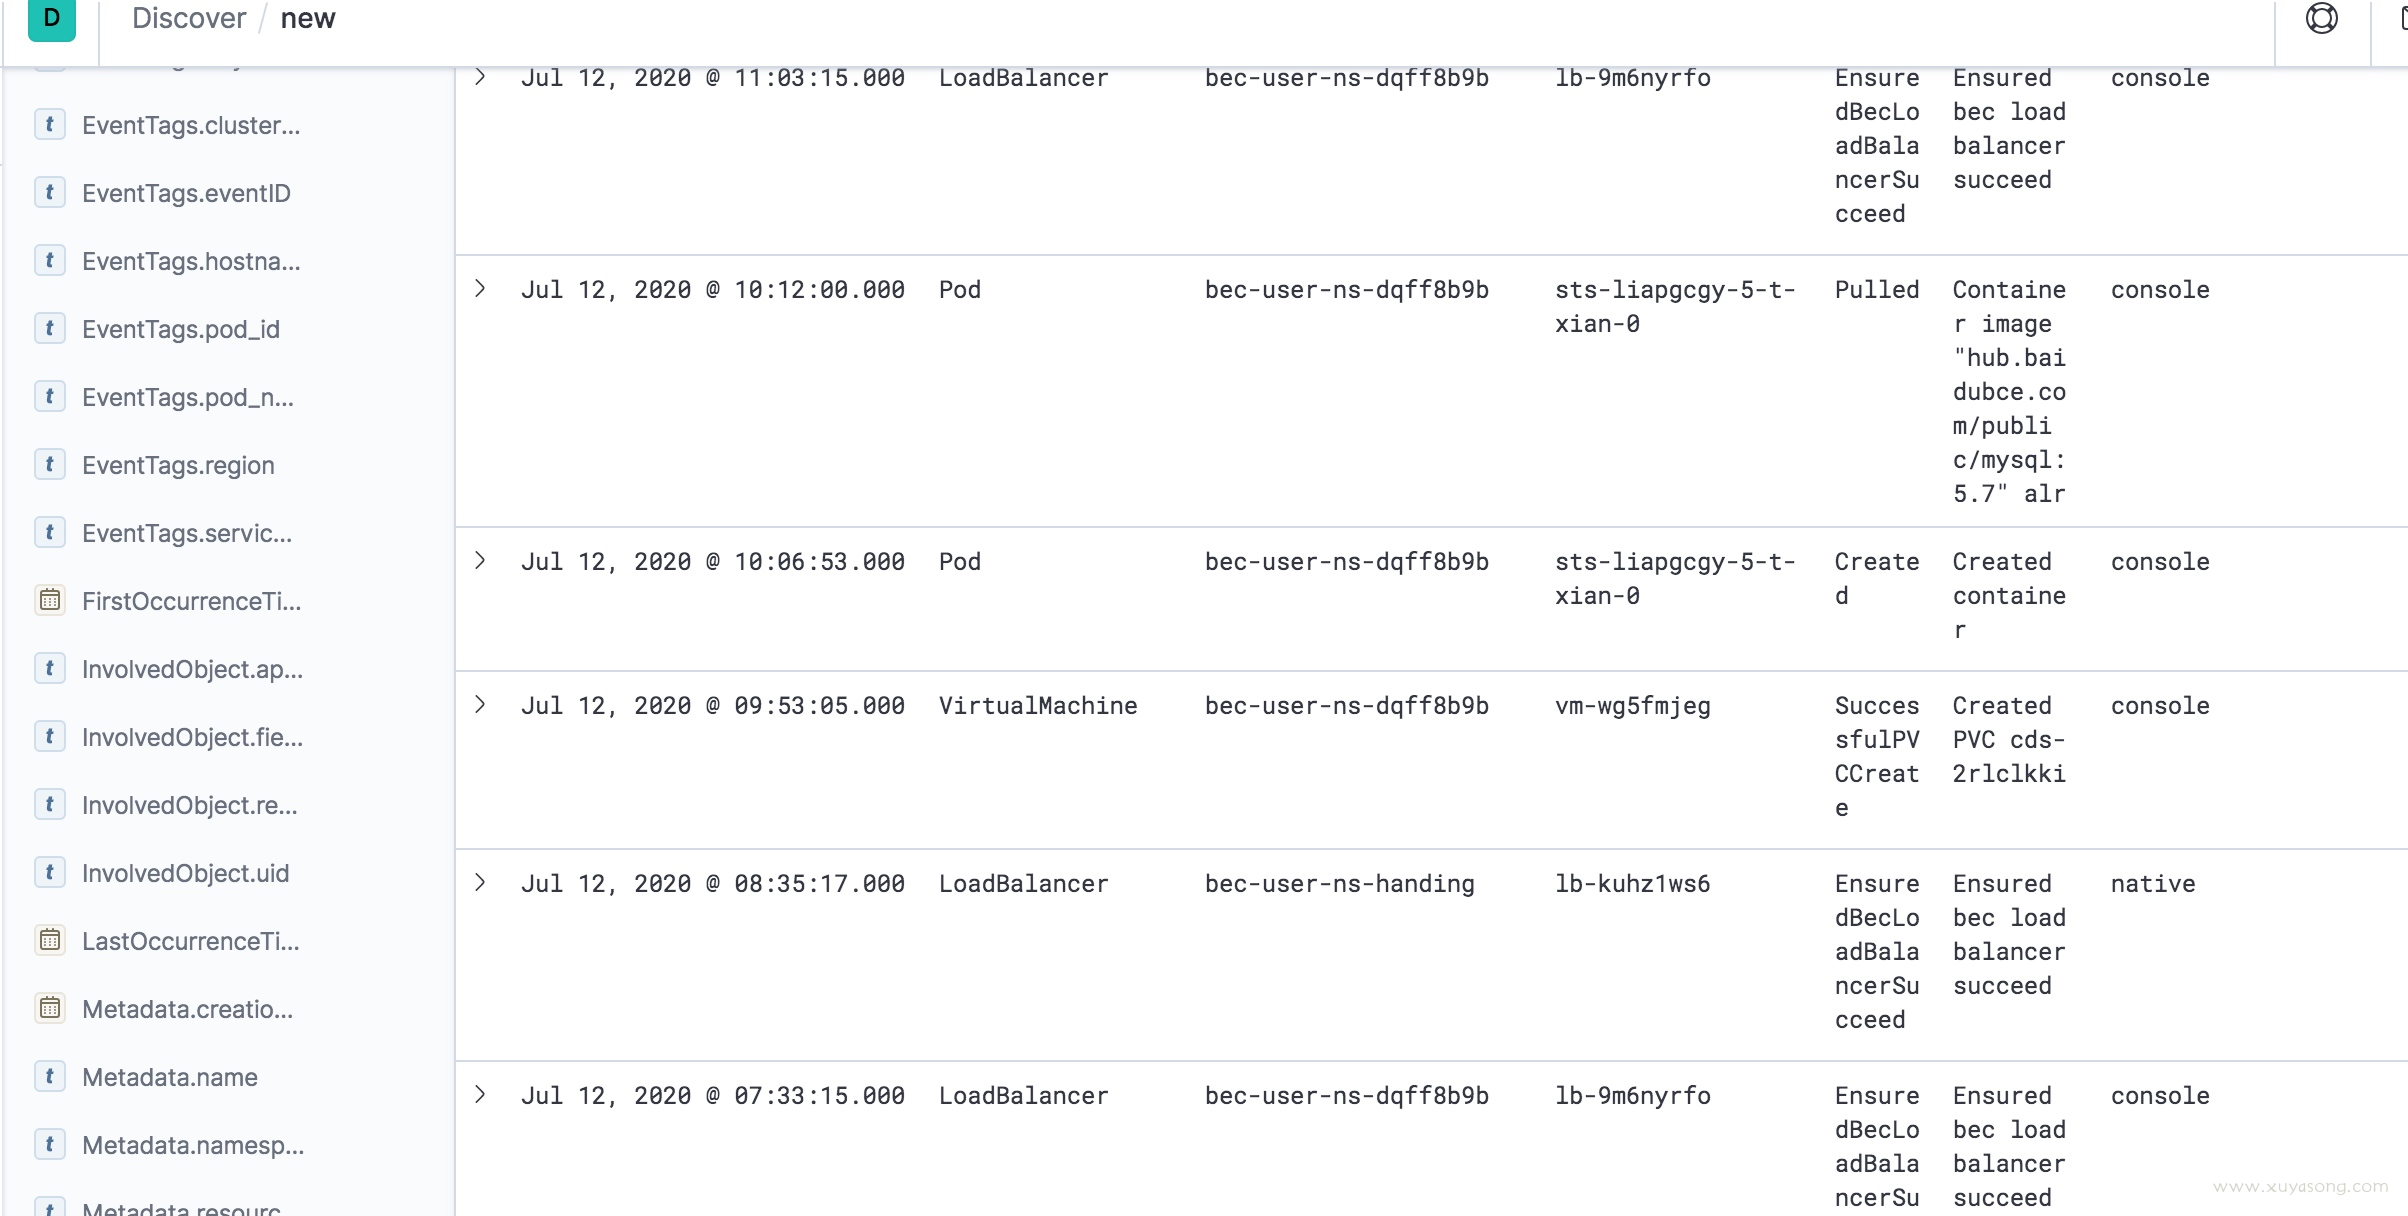
自己做 dashboard
events 数据并不是无限制保存,可以限定保留时间,如1个月,可以定期清理 es 的 index
#!/bin/bash
searchIndex=logstash-monitor
elastic_url=logging.core.k94.kvk.nl
elastic_port=9200

date2stamp () {
    date --utc --date "$1" +%s
}

dateDiff (){
    case $1 in
        -s)   sec=1;      shift;;
        -m)   sec=60;     shift;;
        -h)   sec=3600;   shift;;
        -d)   sec=86400;  shift;;
        *)    sec=86400;;
    esac
    dte1=$(date2stamp $1)
    dte2=$(date2stamp $2)
    diffSec=$((dte2-dte1))
    if ((diffSec < 0)); then abs=-1; else abs=1; fi
    echo $((diffSec/sec*abs))
}

for index in $(curl -s "${elastic_url}:${elastic_port}/_cat/indices?v" |     grep -E " ${searchIndex}-20[0-9][0-9]\.[0-1][0-9]\.[0-3][0-9]" | awk '{     print $3 }'); do
  date=$(echo ${index: -10} | sed 's/\./-/g')
  cond=$(date +%Y-%m-%d)
  diff=$(dateDiff -d $date $cond)
  echo -n "${index} (${diff})"
  if [ $diff -gt 1 ]; then
    echo " / DELETE"
    # curl -XDELETE "${elastic_url}:${elastic_port}/${index}?pretty"
  else
    echo ""
  fi
done
几个注意点:
- 如果你的集群规模很大,events 的量也会比较大,可以根据 event 中的 invole kind 来筛选你需要的资源,如只收集特定 namespace 下的 pod 事件等,减少存储压力
- 可以在 event tag 里加入你需要的字段,方便后续筛选和归类
- 如果是多租户场景,可以按租户 id(如 namespace)做 index,提高查询效率
- 如果是多副本同时推送 events,需要注意 event uid 的唯一性,如两个 k8s 集群推送到 1 个 es 中,原始的event uid是有可能冲突的,需要加上集群标识以保证唯一
- es 集群本身的高可用:replicas + shard
分析与报警
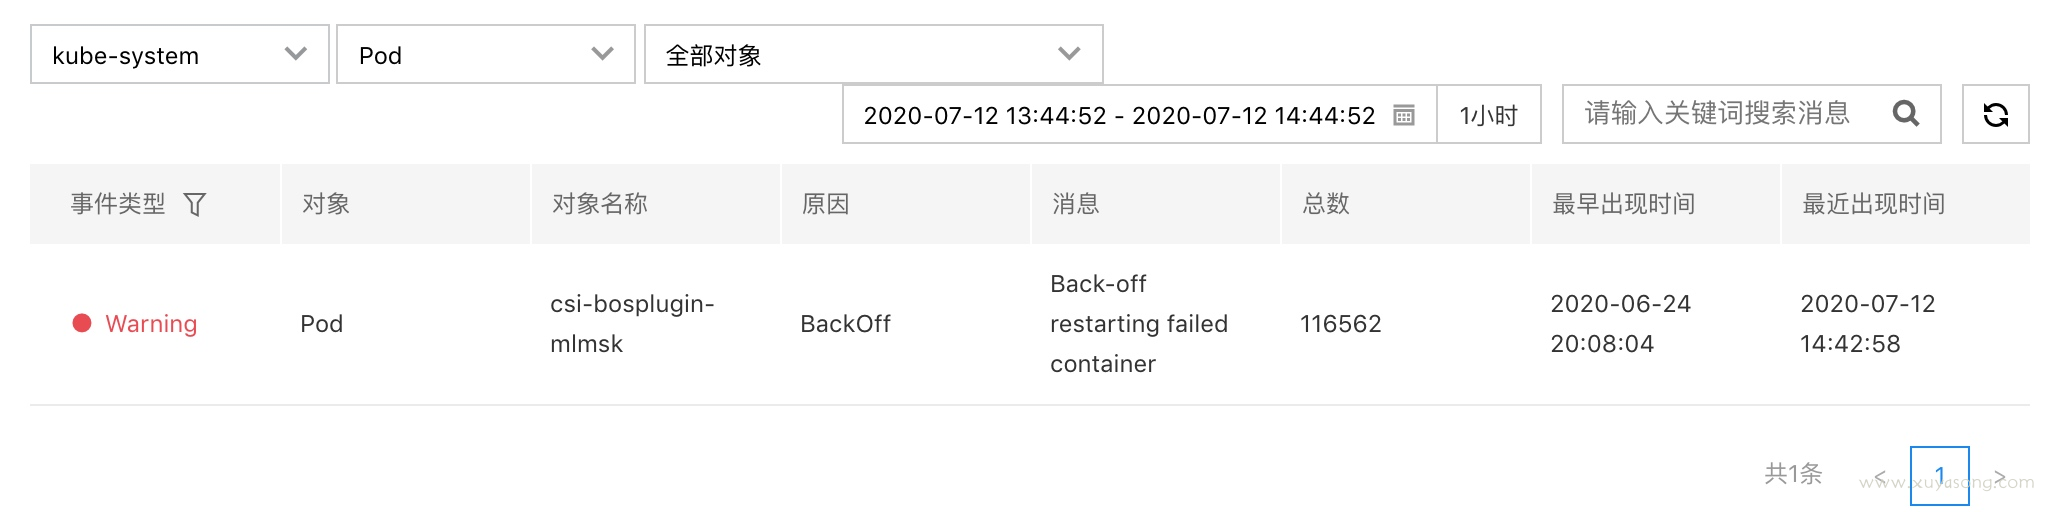
events 采集后除了按条件查询,还可以做一些分析和报警,如 pod 创建失败的次数,image 的平均拉取时间,并配合 es-alert 等工具进行报警。
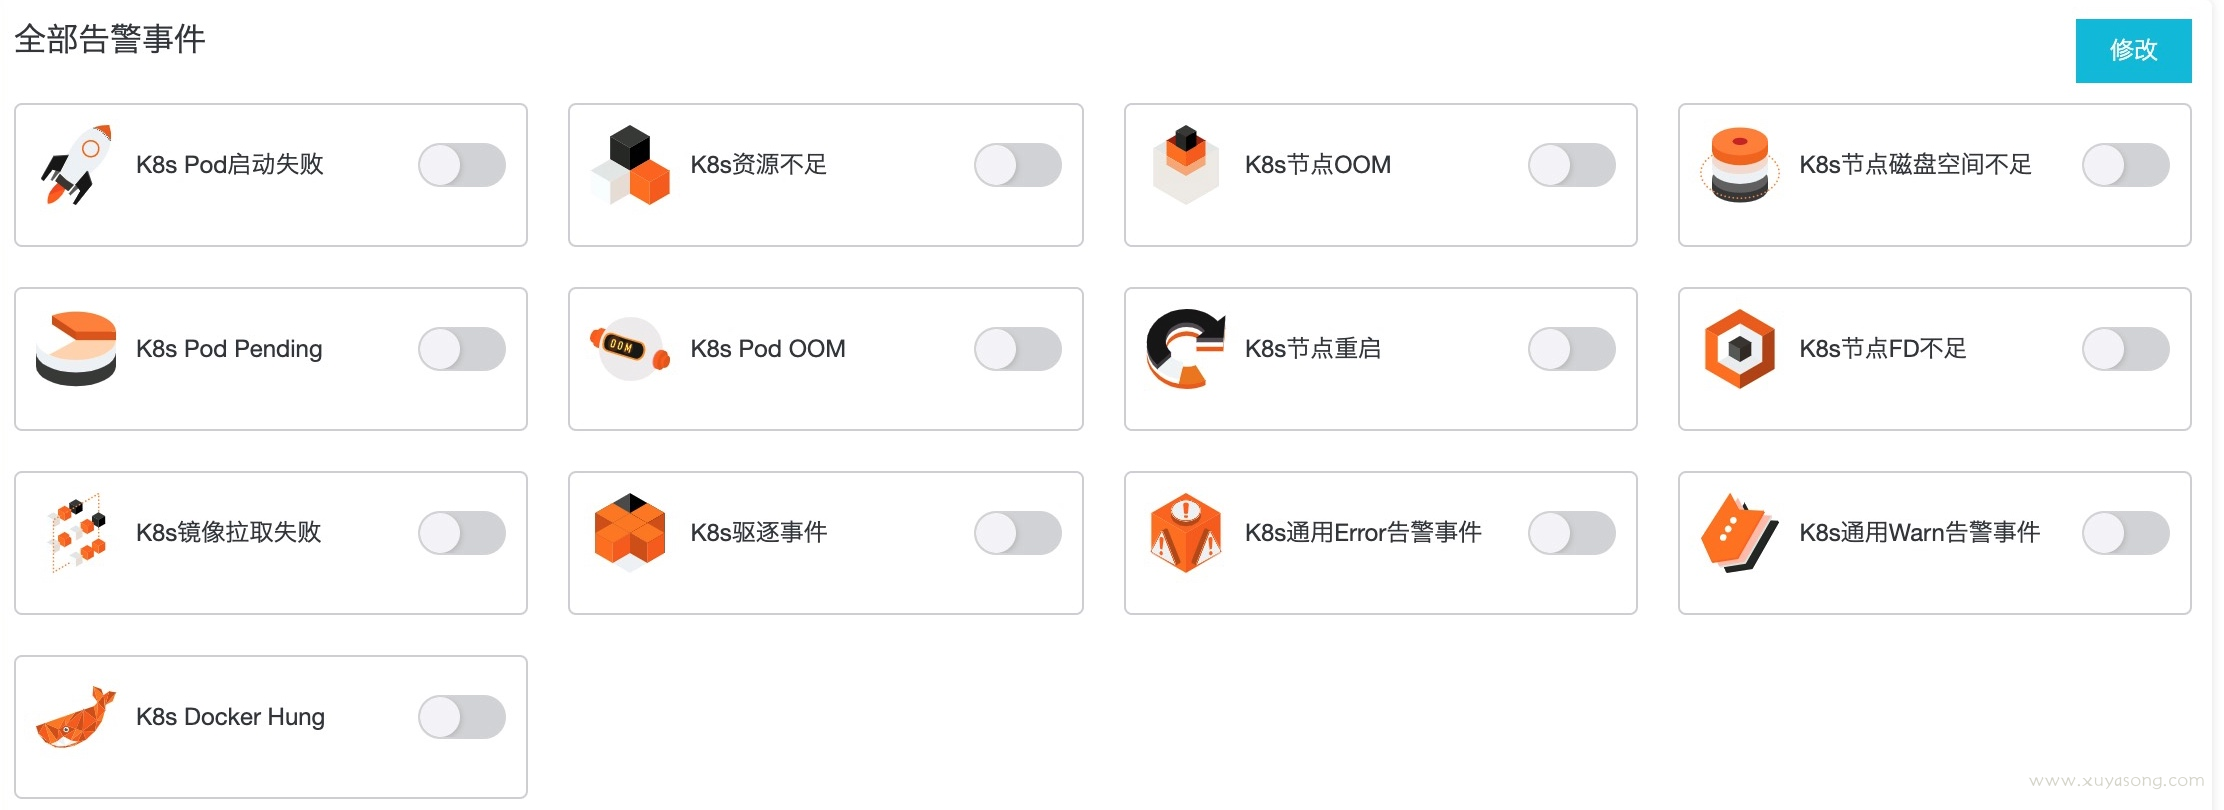
以阿里云的事件中心为例:常见的一些事件报警策略:
原理
K8s 中哪些组件会上报 events ?
只要在 k8s.io/kubernetes/cmd 目录下暴力搜索一下就能知道哪些组件会产生 events:
grep -R -n -i "EventRecorder"
可以看出,controller-manage、kube-proxy、kube-scheduler、kubelet 都使用了 EventRecorder,event的操作被封装在client-go/tools/record包,我们可以自定义自己的event。
event的yaml 结构:
apiVersion: v1
count: 1
type: Normal
kind: Event
source:
  component: kubelet
  host: minikube
eventTime: null
firstTimestamp: ""
involvedObject:
  apiVersion: v1
  kind: Pod
  name: example-foo-d75d8587c-xsf64
  namespace: default
  resourceVersion: "429837"
  uid: ce611c62-6c1a-4bd8-9029-136a1adf7de4
lastTimestamp: ""
message: Pod sandbox changed, it will be killed and re-created.
metadata:
  creationTimestamp: "2020-03-02T13:08:30Z"
  name: example-foo-d75d8587c-xsf64.15f87ea1df862b64
  namespace: default
  resourceVersion: "479466"
  selfLink: /api/v1/namespaces/default/events/example-foo-d75d8587c-xsf64.15f87ea1df862b64
  uid: 9fe6f72a-341d-4c49-960b-e185982d331a
reason: SandboxChanged
reportingComponent: ""
reportingInstance: ""
以 kubelet 为例,写入 events 的流程:
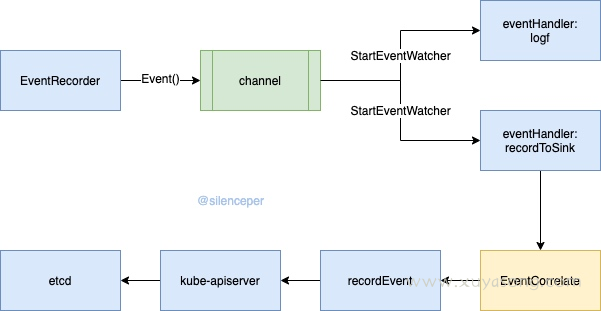
- 创建 EventRecorder 对象,通过其提供的 Event 等方法,创建好event对象
- 将创建出来的对象发送给 EventBroadcaster 中的channel中
- EventBroadcaster 通过后台运行的goroutine,从管道中取出事件,并广播给提前注册好的handler处理
- 当输出log的handler收到事件就直接打印事件
- 当 EventSink handler收到处理事件就通过预处理之后将事件发送给apiserver
- 其中预处理包含三个动作,1、限流 2、聚合 3、计数
- apiserver收到事件处理之后就存储在etcd中
结构体
type Event struct {
    metav1.TypeMeta `json:",inline"`
    // Standard object's metadata.
    // More info: https://git.k8s.io/community/contributors/devel/sig-architecture/api-conventions.md#metadata
    metav1.ObjectMeta `json:"metadata" protobuf:"bytes,1,opt,name=metadata"`

    // The object that this event is about.
    InvolvedObject ObjectReference `json:"involvedObject" protobuf:"bytes,2,opt,name=involvedObject"`

    // This should be a short, machine understandable string that gives the reason
    // for the transition into the object's current status.
    // TODO: provide exact specification for format.
    // +optional
    Reason string `json:"reason,omitempty" protobuf:"bytes,3,opt,name=reason"`

    // A human-readable description of the status of this operation.
    // TODO: decide on maximum length.
    // +optional
    Message string `json:"message,omitempty" protobuf:"bytes,4,opt,name=message"`

    // The component reporting this event. Should be a short machine understandable string.
    // +optional
    Source EventSource `json:"source,omitempty" protobuf:"bytes,5,opt,name=source"`

    // The time at which the event was first recorded. (Time of server receipt is in TypeMeta.)
    // +optional
    FirstTimestamp metav1.Time `json:"firstTimestamp,omitempty" protobuf:"bytes,6,opt,name=firstTimestamp"`

    // The time at which the most recent occurrence of this event was recorded.
    // +optional
    LastTimestamp metav1.Time `json:"lastTimestamp,omitempty" protobuf:"bytes,7,opt,name=lastTimestamp"`

    // The number of times this event has occurred.
    // +optional
    Count int32 `json:"count,omitempty" protobuf:"varint,8,opt,name=count"`

    // Type of this event (Normal, Warning), new types could be added in the future
    // +optional
    Type string `json:"type,omitempty" protobuf:"bytes,9,opt,name=type"`

    // Time when this Event was first observed.
    // +optional
    EventTime metav1.MicroTime `json:"eventTime,omitempty" protobuf:"bytes,10,opt,name=eventTime"`

    // Data about the Event series this event represents or nil if it's a singleton Event.
    // +optional
    Series *EventSeries `json:"series,omitempty" protobuf:"bytes,11,opt,name=series"`

    // What action was taken/failed regarding to the Regarding object.
    // +optional
    Action string `json:"action,omitempty" protobuf:"bytes,12032130,opt,name=action"`

    // Optional secondary object for more complex actions.
    // +optional
    Related *ObjectReference `json:"related,omitempty" protobuf:"bytes,13,opt,name=related"`

    // Name of the controller that emitted this Event, e.g. `kubernetes.io/kubelet`.
    // +optional
    ReportingController string `json:"reportingComponent" protobuf:"bytes,14,opt,name=reportingComponent"`

    // ID of the controller instance, e.g. `kubelet-xyzf`.
    // +optional
    ReportingInstance string `json:"reportingInstance" protobuf:"bytes,15,opt,name=reportingInstance"`
}
如果你需要输出自己的 events,如写 operator 时crd 的事件,可以移入k8s.io/client-go/tools/record中的EventRecorder方法。
审计
介绍
审计日志可以记录所有对 apiserver 接口的请求, 每一个请求都会有几个阶段,每个阶段都有对应的日志,当前支持的阶段有:
- RequestReceived – apiserver 在接收到请求后且在将该请求下发之前会生成对应的审计日志。
- ResponseStarted – 在响应 header 发送后并在响应 body 发送前生成日志。这个阶段仅为长时间运行的请求生成(例如 watch)。
- ResponseComplete – 当响应 body 发送完并且不再发送数据。
- Panic – 当有 panic 发生时生成。
也就是说对 apiserver 的每一个请求理论上会有三个阶段的审计日志生成。
当前支持的日志记录级别有:
- None – 不记录日志。
- Metadata – 只记录 Request 的一些 metadata (例如 user, timestamp, resource, verb 等),但不记录 Request 或 Response 的body。
- Request – 记录 Request 的 metadata 和 body。
- RequestResponse – 最全记录方式,会记录所有的 metadata、Request 和 Response 的 body。
采集
审计支持两种收集方式:保存为日志文件和调用自定义的 webhook,需要配置在 apiserver 的启动参数中
保存为日志文件:
--audit-policy-file=/etc/kubernetes/audit-policy.yaml
--audit-log-path=/var/log/kube-audit
--audit-log-format=json
保存后可以通过 EFK 等方式做日志收集、分析。
调用 webhook:
- –audit-webhook-mode=batch \
- –audit-webhook-batch-max-size=40 \
- –audit-webhook-config-file=/etc/kubernetes/audit-webhook.conf \
- –audit-policy-file=/etc/kubernetes/audit-policy.yaml \
webhook 配置文件实际上是一个 kubeconfig,apiserver 会将审计日志发送到指定的 webhook 后,webhook 接收到日志后再做处理,如对接公司内的审计中心。
audit-webhook.conf的示例:
apiVersion: v1
kind: Config
clusters:
  - cluster:
      server: http://127.0.0.1:17658/audit
    name: kubernetes
contexts:
- context:
    cluster: kubernetes
    user: ""
  name: default-context
current-context: default-context
preferences: {}
users: []
audit-policy.yaml定义了采集策略,示例:
apiVersion: v1
kind: Config
clusters:
  - cluster:
      server: http://127.0.0.1:17658/audit
    name: kubernetes
contexts:
- context:
    cluster: kubernetes
    user: ""
  name: default-context
current-context: default-context
preferences: {}
users: []
[root@instance-vfbo7t74-1 ~]# cat /etc/kubernetes/audit-policy.yaml
apiVersion: audit.k8s.io/v1beta1
kind: Policy
omitStages:
  - "RequestReceived"
rules:
  - level: None
    users: ["system:kube-proxy"]
    verbs: ["watch"]
    resources:
      - group: ""
        resources: ["endpoints", "services"]
  - level: None
    users: ["system:unsecured"]
    namespaces: ["kube-system"]
    verbs: ["get"]
    resources:
      - group: ""
        resources: ["configmaps"]
  - level: None
    users: ["kubelet"] # legacy kubelet identity
    verbs: ["get"]
    resources:
      - group: ""
        resources: ["nodes"]
  - level: None
    userGroups: ["system:nodes"]
    verbs: ["get"]
    resources:
      - group: ""
        resources: ["nodes"]
  - level: None
    userGroups: ["system:masters"]
    verbs: ["patch", "update"]
    resources:
      - group: ""
        resources: ["nodes"]
  - level: None
    users:
      - system:kube-controller-manager
      - system:kube-scheduler
      - system:serviceaccount:kube-system:endpoint-controller
    verbs: ["get", "update"]
    namespaces: ["kube-system"]
    resources:
      - group: ""
        resources: ["endpoints"]
  - level: None
    users: ["system:apiserver"]
    verbs: ["get"]
    resources:
      - group: ""
        resources: ["namespaces"]
  - level: None
    nonResourceURLs:
      - /healthz*
      - /version
      - /swagger*
  - level: None
    resources:
      - group: ""
        resources: ["events"]
  - level: None
    userGroups:
      - system:kube-cloud-controller-manager
    verbs: ["patch", "update"]
    resources:
      - group: ""
        resources: ["nodes/status"]
  - level: Request
    verbs: ["create", "delete", "update", "patch"]
    resources:
      - group: ""
      - group: "apps"
      - group: "autoscaling"
      - group: "batch"
      - group: "policy"
      - group: "rbac.authorization.k8s.io"
      - group: "settings.k8s.io"
      - group: "storage.k8s.io"
      - group: "extensions"
  - level: RequestResponse
    verbs: ["create", "delete", "update", "patch"]
    resources:
      - group: ""
      - group: "apps"
      - group: "autoscaling"
      - group: "batch"
      - group: "policy"
      - group: "rbac.authorization.k8s.io"
      - group: "settings.k8s.io"
      - group: "storage.k8s.io"
      - group: "extensions"
webhook
webhook 需要启动 http server,接收来自 apiserver 推送的 audit log,然后解析为自己需要的格式。
简单示例:
https://github.com/gosoon/k8s-audit-webhook/blob/master/main.go
package main

import (
    "encoding/json"
    "fmt"
    "io/ioutil"
    "log"
    "net/http"
    "time"

    "github.com/emicklei/go-restful"
    "github.com/gosoon/glog"
    "k8s.io/apiserver/pkg/apis/audit"
)

// AuditEvent xxx
type AuditEvent struct {
    Operate int `json:"operate"`
    Data    `json:"data"`
}

// Data xxx
type Data struct {
    audit.Event
}

func main() {
    // NewContainer creates a new Container using a new ServeMux and default router (CurlyRouter)
    container := restful.NewContainer()
    ws := new(restful.WebService)
    ws.Path("/audit").
        Consumes(restful.MIME_JSON).
        Produces(restful.MIME_JSON)
    ws.Route(ws.POST("/{region}/webhook").To(AuditWebhook))

    //WebService ws2被添加到container2中
    container.Add(ws)
    server := &http.Server{
        Addr:    ":8081",
        Handler: container,
    }
    //go consumer()
    log.Fatal(server.ListenAndServe())
}

func AuditWebhook(req *restful.Request, resp *restful.Response) {
    region := req.PathParameter("region")
    body, err := ioutil.ReadAll(req.Request.Body)
    if err != nil {
        glog.Errorf("read body err is: %v", err)
    }
    var eventList audit.EventList
    err = json.Unmarshal(body, &eventList)
    if err != nil {
        glog.Errorf("unmarshal failed with:%v,body is :\n", err, string(body))
        return
    }
    for _, event := range eventList.Items {
        event.TimeStamp = fmt.Sprintf("%v", time.Now().UnixNano()/1e6)
        event.Region = region
        auditEvent := &AuditEvent{
            Operate: 100001,
            Data:    Data{event},
        }
        jsonBytes, err := json.Marshal(auditEvent)
        if err != nil {
            glog.Infof("marshal failed with:%v,event is \n %+v", err, event)
        }
        glog.Info(string(jsonBytes))
        // asyncProducer(string(jsonBytes))
    }
    resp.AddHeader("Content-Type", "application/json")
    resp.WriteEntity("success")
}
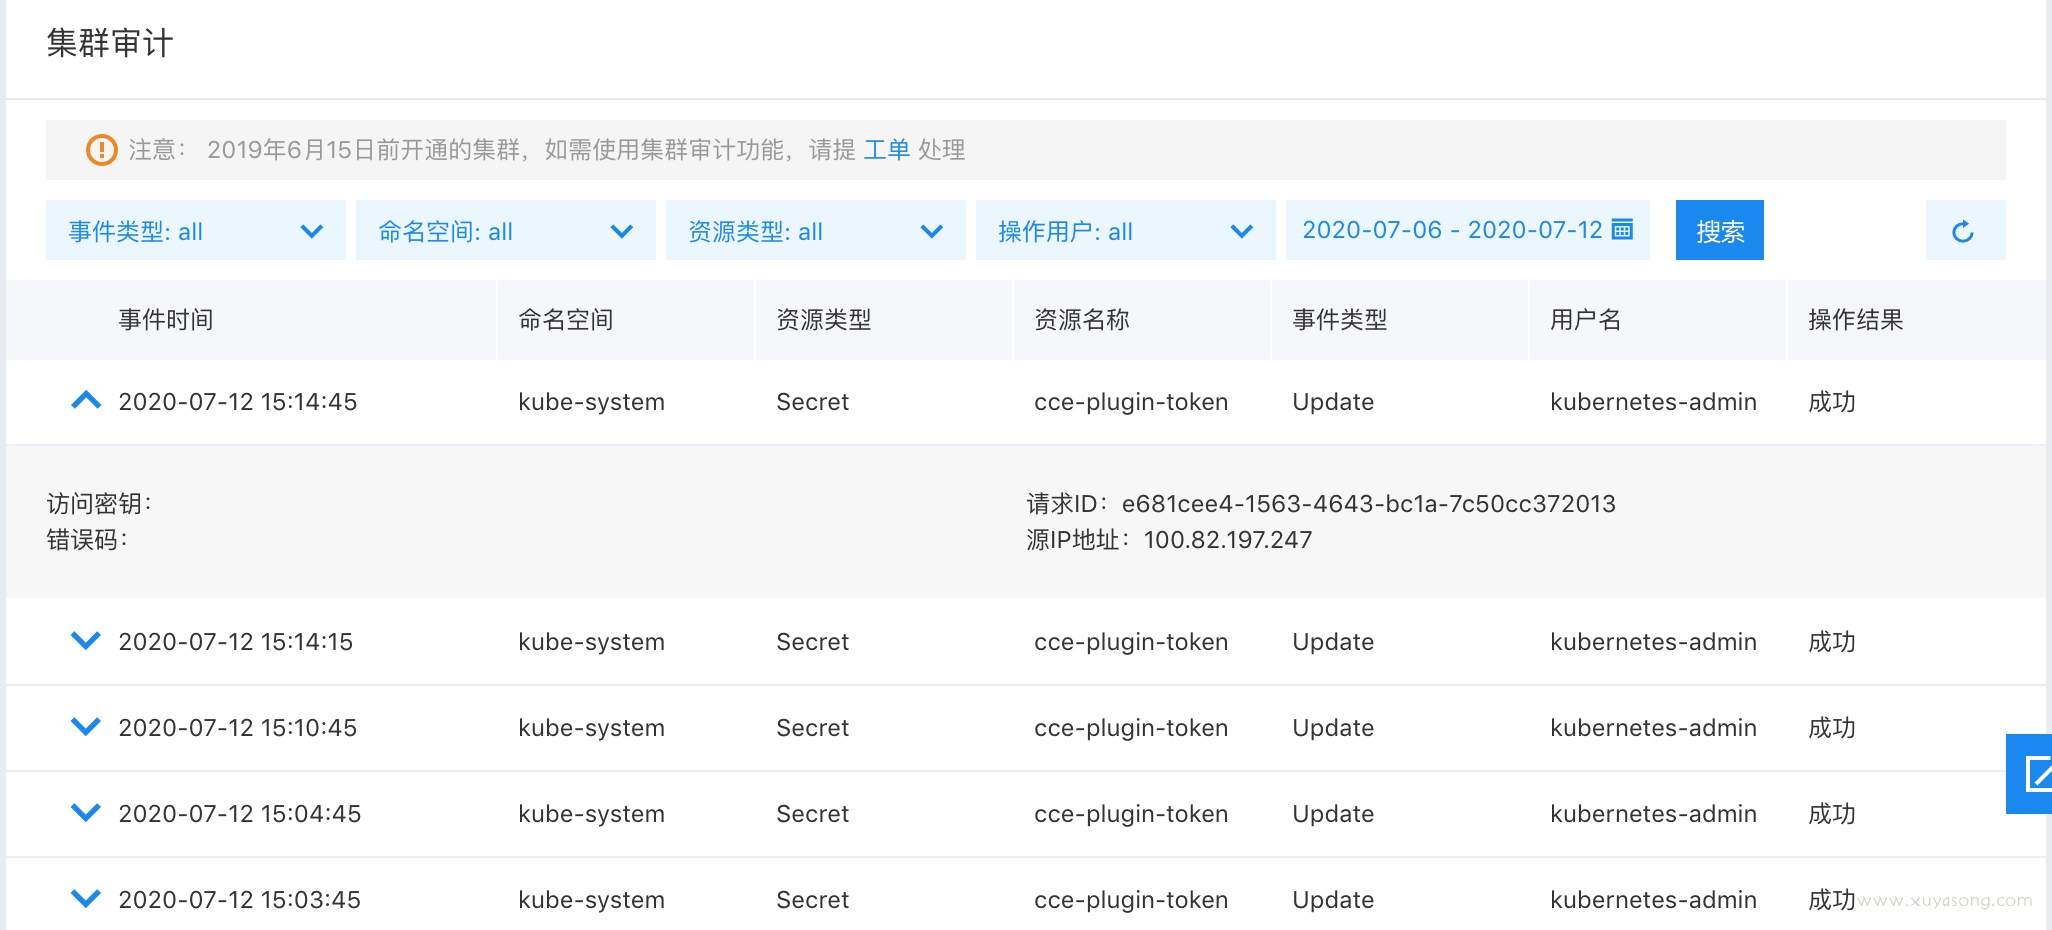
审计中心示例:
参考
- https://yq.aliyun.com/articles/745567
- https://blog.csdn.net/fly910905/article/details/104851310
- https://kubernetes.io/zh/docs/tasks/debug-application-cluster/events-stackdriver/
- https://www.youtube.com/watch?v=ZK2SS_GXF-g
- https://www.youtube.com/watch?v=_s0o_xAF3Pg
- https://www.youtube.com/watch?v=PLSDvFjR9HY
- https://cizixs.com/2017/06/22/kubelet-source-code-analysis-part4-event/
- https://www.jianshu.com/p/8117bc2fb966
说点什么
欢迎讨论