一.概述
Dockbix意为docker+zabbix,即使用zabbix来监控docker容器的插件或者模块,既然有专业的cadvisor、prometheus等容器监控方案,为什么还要用传统的zabbix呢?
- 在docker刚出现时,还没有专业的容器监控方案
- 公司已有zabbix的成熟实践,想直接集成到zabbix中(虽然不太优雅)
使用zabbix来监控docker有几种方案,比如:
- 自己写agent,利用docker的api获取stats信息,暴露api接口给zabbix采集
- 使用zabbix的Module,将docker的采集展示集成到现有的zabbix系统中
如何使用
写API
python sdk:https://docker-py.readthedocs.io/en/stable/containers.html#docker.models.containers.Container.stats
stats(**kwargs)
Stream statistics for this container. Similar to the docker stats command.

Parameters:
decode (bool) – If set to true, stream will be decoded into dicts on the fly. Only applicable if stream is True. False by default.
stream (bool) – If set to false, only the current stats will be returned instead of a stream. True by default.
Raises:
docker.errors.APIError – If the server returns an error.
如计算cpu:
def calculate_cpu_percent(d):
    cpu_count = len(d["cpu_stats"]["cpu_usage"]["percpu_usage"])
    cpu_percent = 0.0
    cpu_delta = float(d["cpu_stats"]["cpu_usage"]["total_usage"]) - \
                float(d["precpu_stats"]["cpu_usage"]["total_usage"])
    system_delta = float(d["cpu_stats"]["system_cpu_usage"]) - \
                   float(d["precpu_stats"]["system_cpu_usage"])
    if system_delta > 0.0:
        cpu_percent = cpu_delta / system_delta * 100.0 * cpu_count
    return cpu_percent
Zabbix Module
通过部署一个zabbix agent的docker容器来监控宿主机器和宿主机器上docker的状态。
搬运下开源项目:https://github.com/monitoringartist/zabbix-docker-monitoring
1.在需要监控的宿主机器上运行运行Agent容器
docker run \
  --name=dockbix-agent-xxl \
  --net=host \
  --privileged \
  -v /:/rootfs \
  -v /var/run:/var/run \
  --restart unless-stopped \
  -e "ZA_Server=<ZABBIX SERVER IP/DNS NAME/IP RANGE>" \
  -e "ZA_ServerActive=<ZABBIX SERVER IP/DNS NAME>" \
  -d monitoringartist/dockbix-agent-xxl-limited:latest
2.配置监控模板
在zabbix server上导入监控docker的模版,可用模板包括:
- Zabbix-Template-App-Docker.xml – 标准推荐模板:被动
- Zabbix-Template-App-Docker-active.xml – 检查模板:主动
- Zabbix-Template-App-Docker-Mesos-Marathon-Chronos.xml – Mesos (Marathon/Chronos)集群的docker模板
也可以用docker镜像直接运行,来导入模板:monitoringartist/zabbix-templates,如:
docker run --rm \
  -e XXL_apiurl=http://zabbix.org/zabbix \
  -e XXL_apiuser=Admin \
  -e XXL_apipass=zabbix \
  monitoringartist/zabbix-templates
item为:
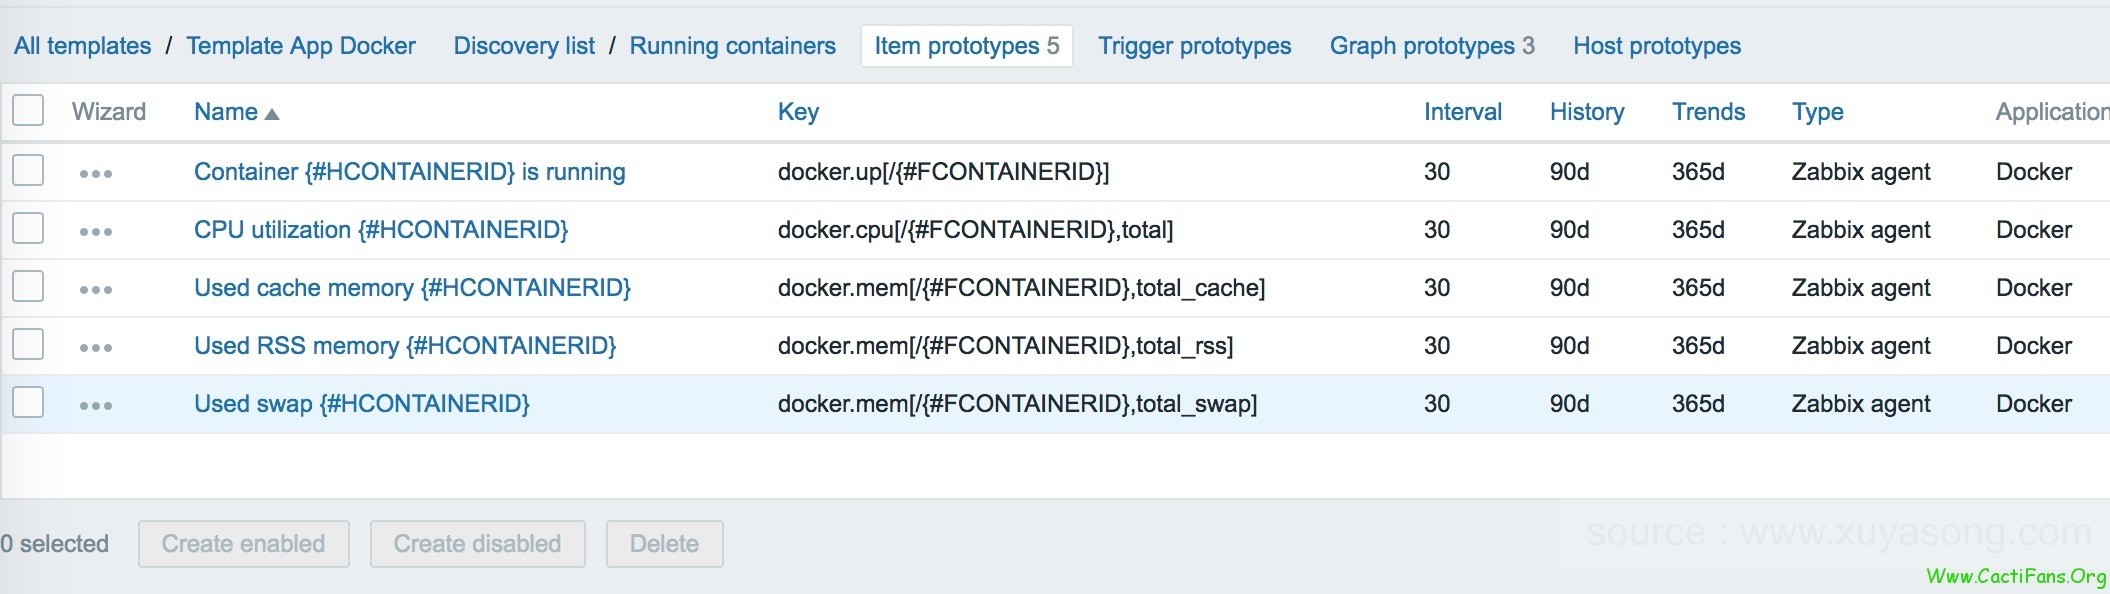
详细的metric的值可以参考:https://github.com/monitoringartist/zabbix-docker-monitoring/blob/master/README.md
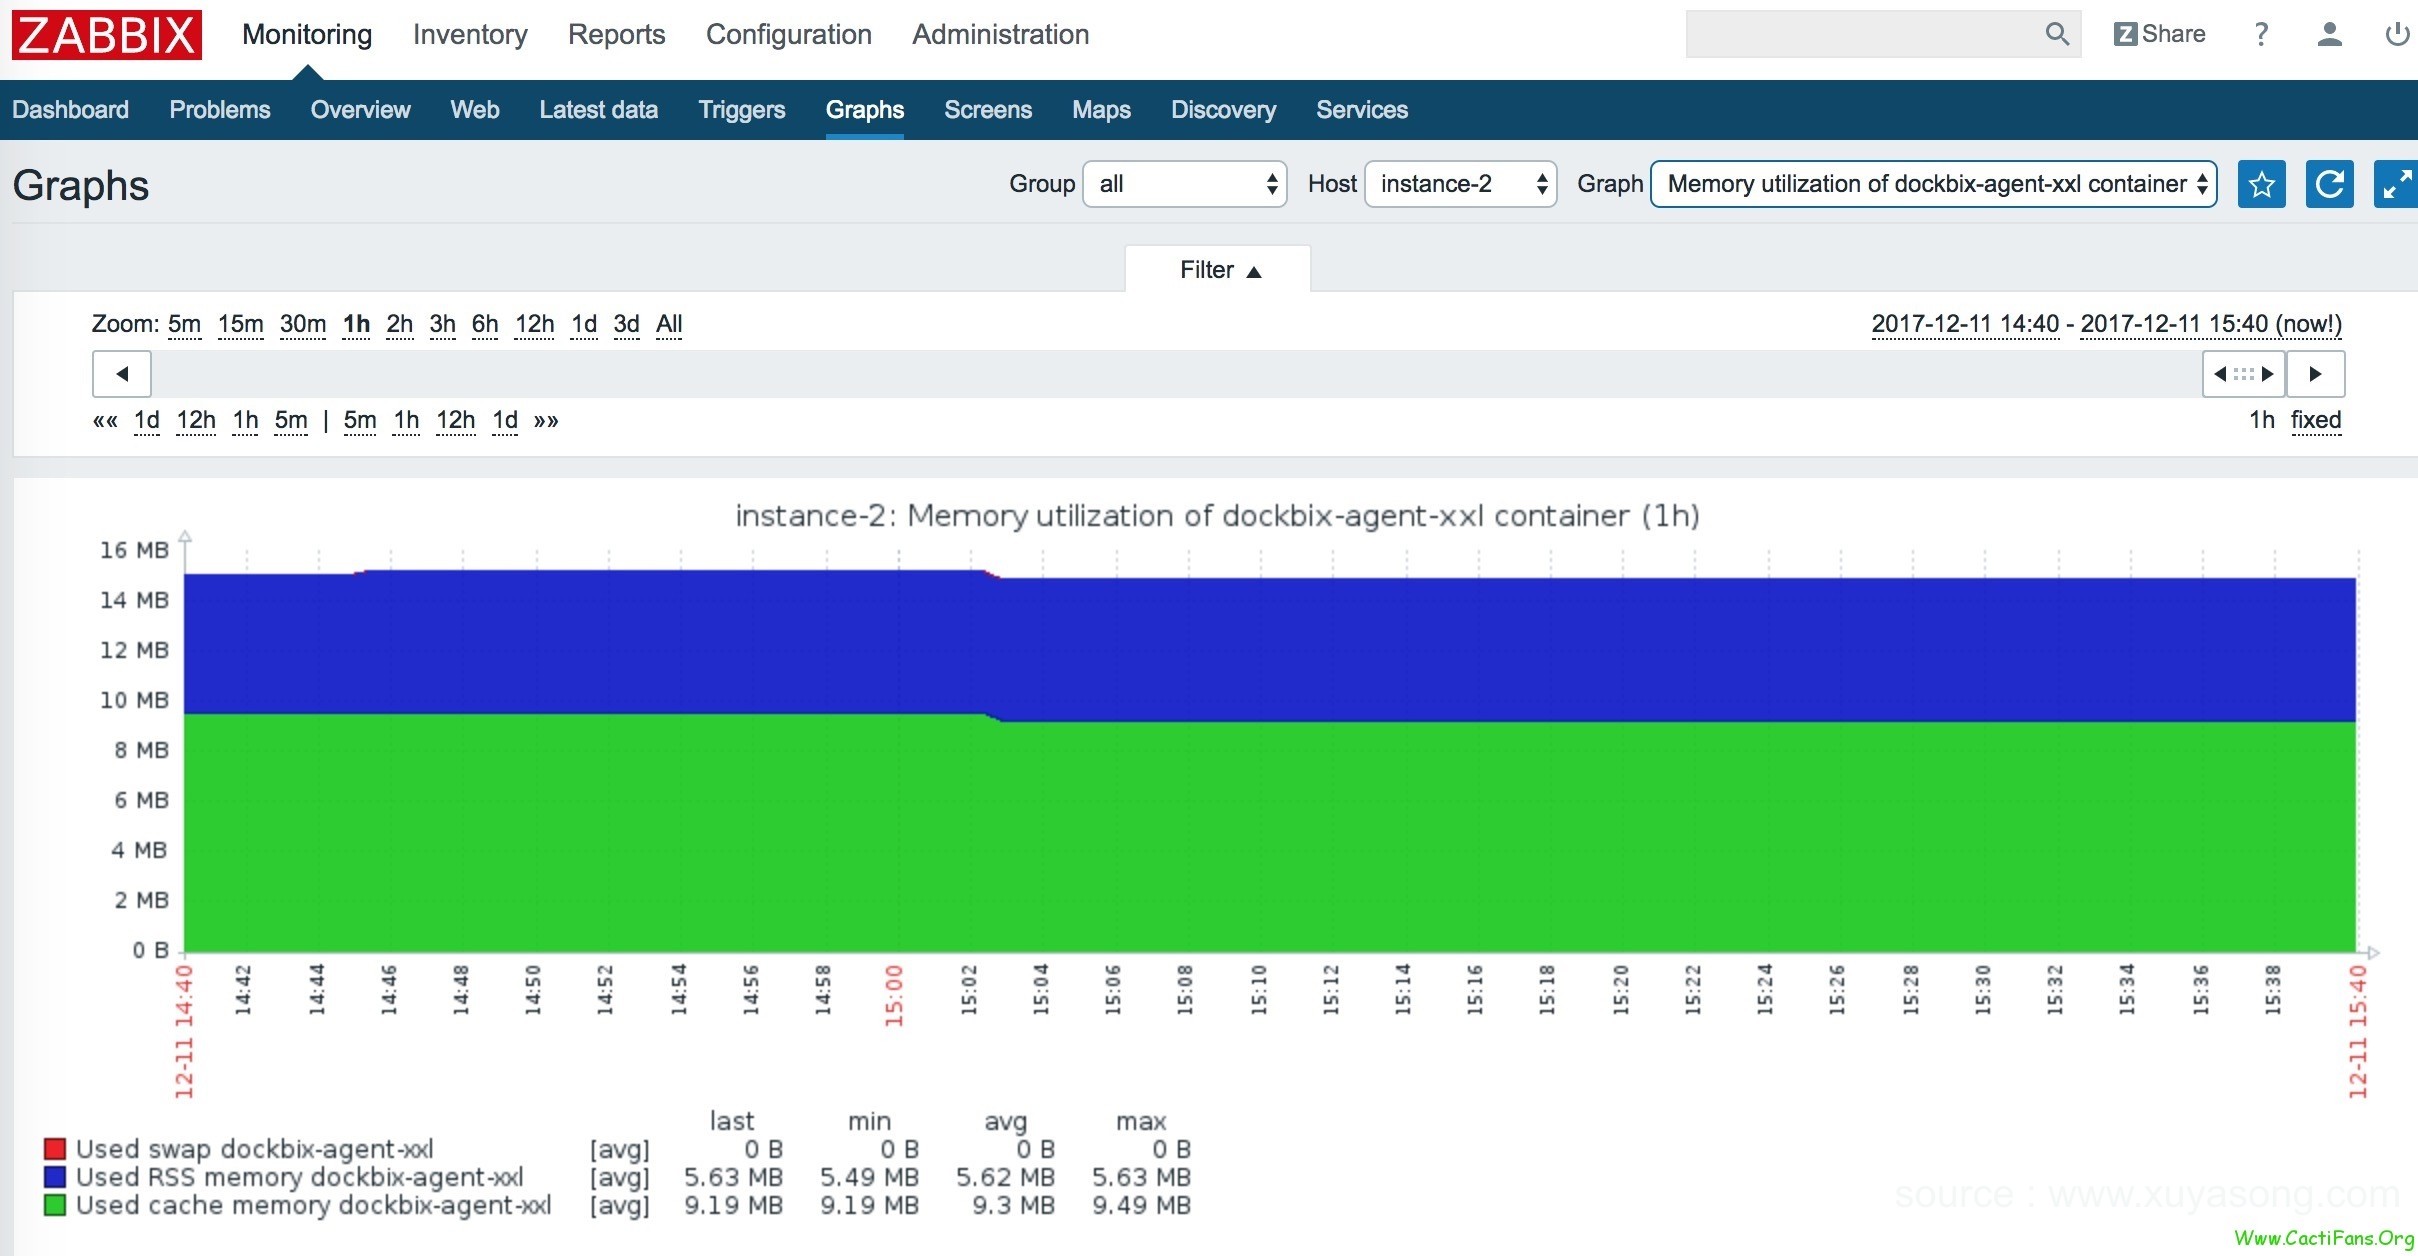
3.可视化
zabbix的监控图:
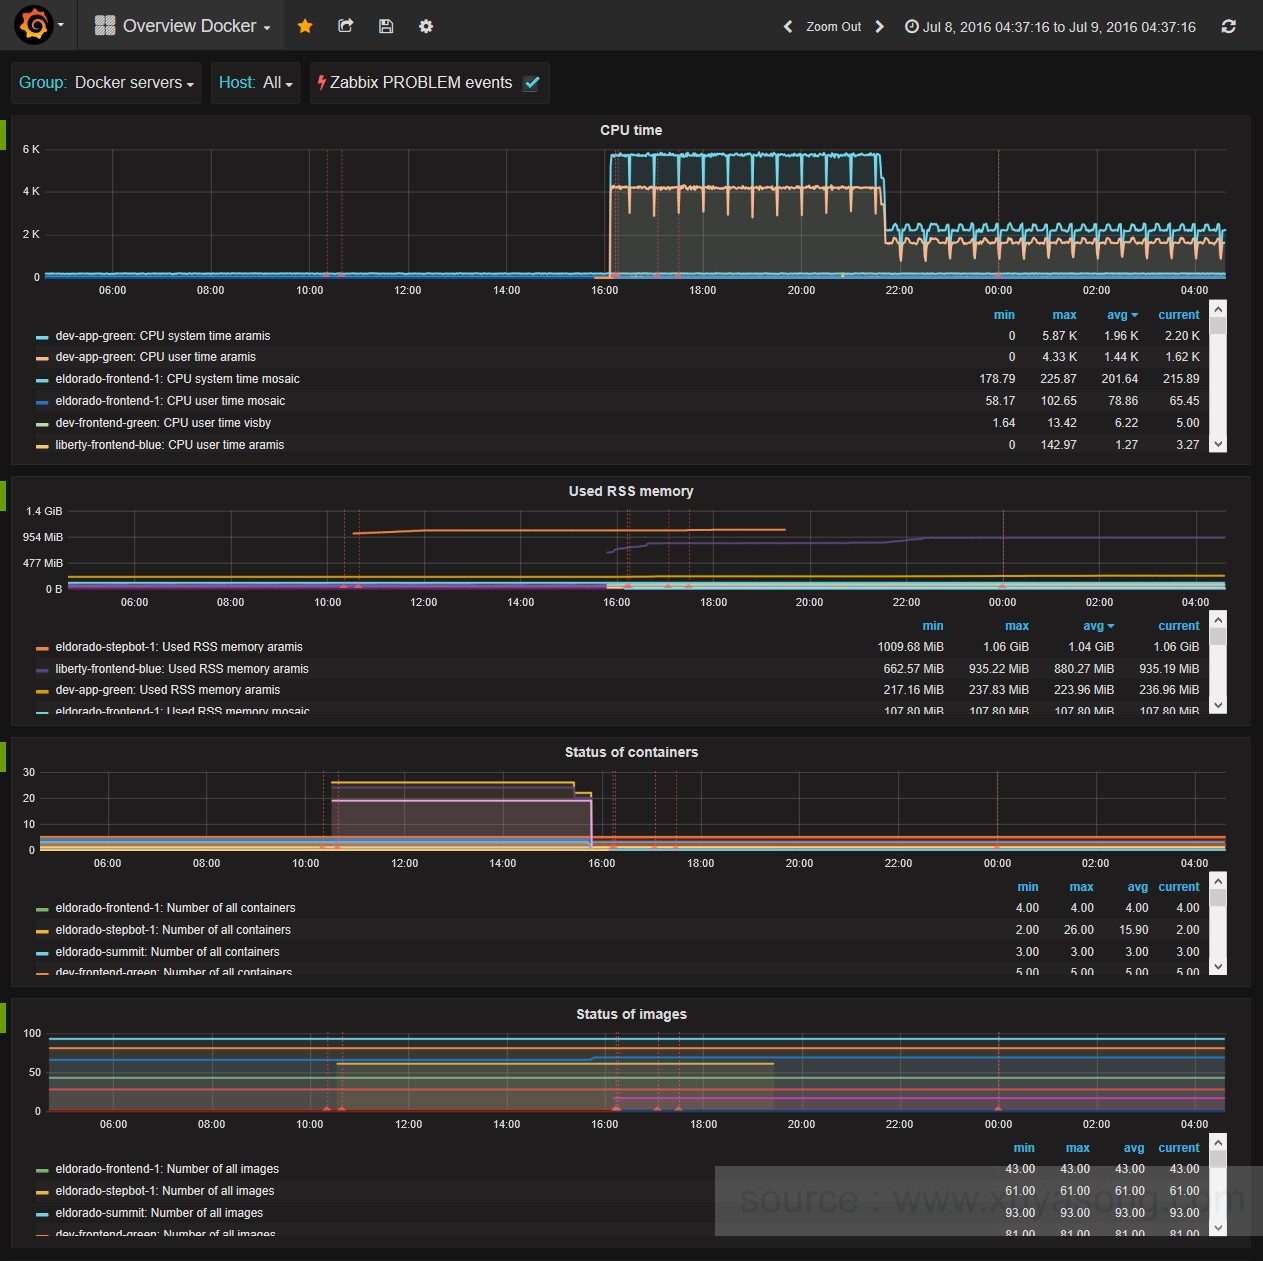
grafana中也有zabbix的数据模板
本文为容器监控实践系列文章,完整内容见:container-monitor-book
说点什么
欢迎讨论